
IntroductionSoft-magnetic materials (SMMs) are receiving increasing attention because of their crucial applications in the transportation and energy sectors1,2,3. The global SMM market is expected to surpass $85 billion by 20264. Significantly, even minor enhancements in the magnetic properties of SMMs can lead to substantial energy conservation. This impetus fuels the pursuit of SMMs with the highest attainable saturation magnetic flux density (Bs> 1.8 T), minimal coercivity (Hc< 300 A m−1)5, and high electrical resistivity (ρ> 50 μΩ cm) while maintaining acceptable mechanical properties and processability. Multicomponent alloys, including medium- and high-entropy alloys (MEAs and HEAs), have surfaced as strong candidates to meet these diverse criteria6,7,8. The vast compositional spectrum of MEAs/HEAs also presents significant prospects for judicious property modulation9. For instance, the recently developed FeCoNiTaAl HEA, characterized by its ferromagnetic matrix combined with paramagnetic coherent nanoprecipitates, shows an admirable synergy of magnetic and mechanical attributes, e.g., a low coercivity of 78 A m−1, a large electrical resistivity of 103 μΩ cm, a tensile strength of 1336 MPa, and a tensile elongation of 54%6. Similarly, a B2 phase-based HEA (Al1.5Co4Fe2Cr) demonstrated a low coercivity of 127 A m−1and a high Curie temperature up to 1334 °C7. Unfortunately, theBsof these multicomponent alloys is usually low (<1 .26 T6,7), limiting their widespread applications. In addition, the processability of soft-magnetic MEAs/HEAs is always poor, which makes the fabrication of magnetic components with complex geometry be especially challenging.In contrast to traditional manufacturing processes, additive manufacturing techniques, especially laser powder bed fusion (LPBF), have the potential to address the aforementioned challenges in processing net-shaped multicomponent alloys10,11,12. The focused high-energy beam in LPBF can melt powders into near fully dense products; simultaneously, the ultrafast cooling rate inherent to the LPBF process deters the emergence of unwanted intermetallic compounds and minimizes the diffusion of constituent elements, facilitating microstructure refinement12. More importantly, this technique enables in situ alloying and microstructure modifications during the LPBF process, allowing the magnetic properties to be tailored for specific applications13. In recent years, laser additive manufacturing has been extensively employed for processing a variety of soft-magnetic materials—including Fe-Ni alloys10, Fe-Co alloys14, Fe-Si alloys15, Fe-based amorphous/nanocrystalline alloys16,17, and also multicomponent alloys18,19,20.Currently, the manipulation of the magnetic properties of additively manufactured soft-magnetic multicomponent alloys predominantly relies on the design of their compositions. For example, Chaudhary et al.18examined the effect of the addition of Al on the microstructure and magnetic properties of an equiatomic CoFeNi MEA by laser engineered net shaping (LENS). They proposed that the introduction of nonferromagnetic Al shifted the phase equilibrium from a single FCC phase to a lamellar FCC/BCC dual phase and eventually to a single BCC (B2) phase with increasing Al content. The optimal alloy, Al10(CoFeNi), characterized by its lamellar FCC/BCC structure, exhibited a saturation magnetization of 127 emu g−1and a Curie temperature of 475 °C, but a relatively high coercivity of 320 A m−1. Recently, Radhakrishnan et al.19reported that the coercivity could be significantly reduced when Cr was incorporated in the equiatomic CoFeNi MEA alloy (6-10 at.% Cr); unfortunately, the saturation magnetization of the alloy also decreased proportionally with increasing Cr content. Despite these intriguing advancements, realizing additively manufactured multicomponent alloys with both highBsand lowHcvalues remains a great challenge.In this study, we chose an FCC/BCC dual phase Fe45Co30Ni25MEA with high saturation magnetic flux density but high coercivity as the base alloy. To tailor the phase structure and related magnetic properties, an approach, namely, in situ phase engineering, is adopted, in which elemental powders (Fe, Co, and Ni) with nanoscale Fe2O3coatings are chosen as feedstocks, which are then subjected to LPBF to complete in situ alloying. The LBPF MEA composite with a single FCC phase in the matrix (rather than FCC/BCC dual phase) incorporated with nano-FeO particles is achieved. After annealing, this composite shows remarkable magnetic characteristics, including a high saturation magnetic flux density (Bs= 2.05 T), low coercivity (Hc= 115 A m−1), and fairly high electrical resistivity (ρ≈ 50 μΩ cm) that is two times greater than that of the casting alloy. The correlation between the phase structure and the resultant magnetic properties is discussed based on Lorentz transmission electron microscope (TEM) analysis.Results and DiscussionAlloy design and material preparationAs a proof-of-concept for our alloy design methodology, we selected a high-saturation magnetic flux density (Bs) soft-magnetic alloy, Fe45Co30Ni25MEA, as the base material. To adjust its phase/structure and magnetic properties, we chose Fe2O3nano-oxide as a powder modifier. The fabrication process for the nano-oxide dispersed MEA is schematically depicted in Fig.1aand comprises two key steps: 1) coating the elemental powders with Fe2O3nano-oxide by a wet chemical approach and 2) in situ alloying of the elemental powders and Fe2O3particles to achieve the desired phases and structures during LPBF process. In the first step, pure elemental Fe, Co, and Ni powders with nominal compositions are premixed by ball milling, and the mixed powders are subsequently coated with Fe2O3nano-oxide particles through a layer-by-layer assembly technique21, as described in detail in the Experimental Section. A real-time video of the Fe2O3coating process was recorded via optical microscope (Video S1). The mixed metal powders with the Fe2O3coating display a red colour and settle at the bottom of the beaker, leaving a layer of clear liquid above (Fig.1a). The uniform distribution of Fe2O3nano-oxides on the surface of individual powders was confirmed through scanning electron microscopy (SEM) imaging (Fig.1b–d) along with energy-dispersive X-ray (EDX) mapping (FigureS1). The mass percentage of the Fe2O3nano-oxides on the powders was estimated to be 5 wt.%. In the second step, the Fe2O3-coated elemental powders are subjected to LPBF for in situ alloying and sample building. This process enables the fabrication of the Fe45Co30Ni25MEA with Fe oxide and assembles large magnetic components with complex 3D geometries, such as the stator in an electric motor (as shown in the inset of Fig.1a), demonstrating the exceptional manufacturability of this chosen MEA system. It is worth noting that the rapid cooling inherent to the LPBF process tends to yield a fine-grained structure and to introduce residual stress in the LPBF sample, which is suboptimal for magnetic properties. To solve these problems, subsequent heat treatment is then applied to the LPBF samples to modify their grain structure and alleviate residual stress. For comparison, the MEA sample without addition of Fe2O3was also prepared via LPBF. Henceforth, the LPBF samples made from elemental powders and the Fe2O3-coated elemental powders are referred to as MEA and OMEA, respectively, while the OMEA sample after heat treatment is referred to as H-OMEA.Fig. 1: Preparation of Fe2O3coated powders and sample fabrication using laser powder bed fusion (LPBF).aSchematic diagram of the preparation of nano Fe2O3coated elemental powders and laser in-situ alloying of FeCoNi medium entropy alloy (MEA). Here, PDDA and PSS are ploy (duallyldimethylammonium chloride) and poly (sodium 4-styrene sulfonate), respectively. The Fe2O3suspension before and after the addition of elemental powders, and the resultant MEA components processed by LPBF, are also presented.b–dSurface morphologies of the elemental powders before and after surface treatment.Full size imageMicrostructural characterization and phase transformationFig.2shows the microstructures of the MEA, OMEA, and H-OMEA samples. In the case of MEA, the X-ray diffraction (XRD) pattern (Fig.2a) reveals a dual phase structure consisting of FCC and BCC phases, consistent with the Fe-Ni-Co ternary phase diagram (FigureS2)22. This result validates the success of in situ alloying by laser additive manufacturing of the mixed elemental powders. Note that the (220) peak of the FCC phase is prominent, indicating the occurrence of a < 110 > texture, while a relatively weak <110> texture in the BCC phase also appears. SEM observations (Fig.2b) along with the corresponding elemental mapping (FigureS3) confirm that the MEA sample is fully dense without voids or composition segregation. Notably, a heterogeneous structure is evident, with coarse grain zones (CGZs) and fine grain zones (FGZs) alternately distributed in the sample. Electron backscattered diffraction (EBSD) inverse pole figures and phase maps (Fig.2c, d) reveal that the CGZs located inside the molten pools (MPs) exhibit columnar grains with FCC structures, while the FGZs positioned at the boundaries of the MPs display equiaxed grains with BCC structure. These columnar grains grow preferentially along the < 110 > direction, which is consistent with the XRD pattern. The volume fraction is approximately 88% for the FCC phase and 12% for the BCC phase, respectively, with average grain sizes of 21.2 μm (in width) for the FCC phase and 4.4 μm (in diameter) for the BCC phase. The geometrically necessary dislocation (GND) density, measured by EBSD, was determined to be 1.59 × 10¹⁴m−2(FigureS4). It is worth noting that the GND density is 1.45 × 10¹⁴m−2in the FCC phase, while the GND density is 3.61 × 10¹⁴m−2in the BCC phase. The higher GNDs density in BCC phase indicates that a greater residual stress exists in this phase, which is attributed to the higher temperature gradient and higher cooling rate at the MP boundaries than at the MPs23.Fig. 2: The phase structure and microstructures of the MEA, OMEA, and H-OMEA samples investigated using XRD, SEM and EBSD.a,e,iXRD patterns,b,f,jcross-section SEM images,c,g,kEBSD micrographs,d,h,lEBSD phase maps of MEA, OMEA and H-OMEA, respectively. The abbreviation “BD” stands for building direction.Full size imageIn contrast, for OMEA, the microstructure significantly changes upon the introduction of Fe2O3nano-oxides. First, the XRD pattern (Fig.2e) only displays the diffraction peaks of the FCC phase, indicating that the BCC phase is completely suppressed due to the addition of the Fe2O3nano-oxide. Second, the (200) peak becomes the most prominent, in contrast to the previous MEA sample where the (220) peak is dominant. These changes suggest that the presence of nano-Fe2O3promotes the formation of the FCC phase and changes the orientation, and the related mechanism will be discussed in a later section. Third, the FCC/BCC dual phase structure in the MEA sample is replaced by a single FCC phase with a uniform columnar structure and an average width of 42.1 μm in the OMEA sample (Fig.2g, h). The length-to-width ratio of these columnar grains is notably larger than that in MEA, because the growth of columnar grains is unlimited without hindrance from BCC equiaxed grains. The GND density in the OMEA was measured to be 1.08 × 10¹⁴m−2(FigureS4), which is lower than that in the MEA. Note that both XRD and EBSD fail to detect the presence of the Fe2O3phase due to its small amount and ultrafine size. However, it is apparent that most of the Fe2O3oxide particles are distributed uniformly in the sample (FigureS5), although slight Fe2O3oxide particle accumulation at the MP boundaries is observed owing to their low mass density.For the H-OMEA sample, which underwent annealing under optimized conditions (1200 °C for 20 h; see details in the Experimental Section and FigureS6), both the XRD pattern and EBSD images (Fig.2i–l) indicate that the primary phase retains FCC structure. However, the columnar grains completely transform into equiaxed grains with an average size of 63.8 μm due to recrystallization and grain coarsening during the annealing treatment. Annealing twins are also observed in the FCC phase (FigureS7). The GND density in H-OMEA was measured to be 3.1 × 10¹³m−2(FigureS4), which is much less than that in the MEA and OMEA samples. In addition to the FCC phase, the FeO phase, rather than Fe2O3, is detected in the XRD pattern, and is believed to be crucial for the transformation from the dual phase (FCC + BCC) in MEA to the single FCC phase in OMEA. This will be discussed in later section.The detailed microstructure and composition of the phases in the MEA, OMEA, and H-OMEA samples were further investigated by TEM and high-angle annular dark field scanning TEM (HAADF-STEM) coupled with energy dispersive X-ray spectroscopy (EDX) mapping. Fig.3a, bdepict the detailed structures in an MP (FCC phase) and an MP boundary (BCC phase) in the MEA, respectively. In the MP (top view), cellular subgrains with sizes ranging from 1–2 μm and cellular boundary thicknesses of 100 nm are observed within each grain. The formation of cellular substructures could be attributed to the accumulation of dislocations at the cellular walls due to the high thermal stress induced by rapid heating and cooling during the LPBF process24,25. The overall composition of the FCC phase in the MP is Fe41.35Co29.80Ni28.85, with a slight enrichment of Ni. It is well known that Ni is an FCC stabilizer, which favours the formation of a pure FCC phase in MPs. On the other hand, at the MP boundary, ultrafine grains approximately 1–2 μm in diameter are formed, and their composition is determined to be Fe42.58Co37.15Ni20.27, marked by slight Co enrichment but Ni depletion compared to the nominal composition of the HEA.Fig. 3: The microstructures of the MEA, OMEA, and H-OMEA samples investigated using TEM.a,bThe bright-field TEM images of the FCC and BCC region in MEA. The insets are the corresponding selected area electron diffraction (SAED) patterns.cThe bright-field TEM image of OMEA, the inset is the SAED pattern of region S1.dThe SAED pattern of region S2 in (c).eThe TEM bright field image of H-OMEA, the inset is the SAED pattern of region S3.fThe SAED pattern of region S4 in (e).Full size imageFigure3c, dpresent a bright-field TEM image and the corresponding selected area electron diffraction (SAED) pattern of the OMEA, revealing an FCC single-phase structure and FeO nanoparticles (~100 nm in diameter) dispersed inside the FCC grains. The stoichiometric ratio of Fe to O in FeO is 0.77, indicating a slight depletion in Fe. Notably, these FeO nanoparticles also have an FCC structure and exhibit an orientation relationship of (020)matrix// (220)FeOwith surrounding matrix (Fig.3d). Note that, apart from the diffraction spots from the MEA matrix and FeO nanoparticles, some weak spots (as indicated by the arrows in Fig.3d) from the secondary diffraction of FeO nanoparticles are frequently detected. The FeO phase does not exist before laser scanning, and its formation is most likely due to the reaction between the Fe powders and the Fe2O3nano-oxide upon heating during laser scanning, i.e., Fe + Fe2O3→ FeO. Similar phenomena have also been reported during high-energy ball milling of Fe and Fe2O3powders26. After heat treatment, the matrix of the H-OMEA sample retains an FCC structure, while the grains of the matrix and FeO oxide particles undergo considerable coarsening, reaching ~63.8 μm for the matrix and ~1 μm for FeO, respectively. Moreover, the stoichiometric ratio of Fe to O in FeO increased to 0.83, indicating the diffusion of O during annealing (Fig.3e).Given the crucial role of FeO nano-oxide in the BCC-to-FCC phase transformation in the OMEA, we further investigated the detailed interfacial structure between FeO particles and the FCC matrix. Fig.4a, bpresent HAADF-STEM images and EDX mapping, revealing that the nanoparticles are enriched with Fe and O. Fig.4cprovides a high-resolution TEM image of the interfacial region. The fast Fourier transform (FFT) pattern confirms again that the nanoparticle is FCC-structured FeO. Remarkably, FeO exhibits a semi-coherent interface with the FCC matrix, characterized by an orientation relationship of (020)matrix// (220)FeObut with a 14% lattice misfit. It is believed that this structural feature favours the formation of a single FCC phase in the studied Fe45Co30Ni25MEA. The detailed process is described as follows: During laser scanning, the reaction between the Fe powders and Fe2O3nano-oxides occurs upon heating, i.e., Fe + Fe2O3→ FeO. Then, both the mixed powders (Fe, Co and Ni) and the nano-FeO particles were melted. According to the Fe-O phase diagram27, the molten mixture separated into two distinct, immiscible liquids: one enriches iron and contains cobalt and nickel, and the other is predominantly composed of FeO. Upon cooling, the FeO phase could first be reprecipitated from the MP because FeO has a higher melting temperature (Tm, FeO= 1425 °C28). With further cooling, the MEA phase forms when the temperature approaches the melting point of the Fe45Co30Ni25MEA (i.e.,Tm, MEA= 1380 °C, measured with DTA (FigureS8)). In this process, the preformed FeO could serve as a nucleating agent and lead to the formation of the FCC phase but suppress BCC phase formation due to the positive effect of the preformed FeO, which also has an FCC structure and a small lattice misfit with the FCC MEA. The unique orientation relationship between FeO and FCC alters the texture of the FCC phase, transitioning it from the original < 110 > to <100 > , as observed in Fig.2.Fig. 4: The morphology of FeO particles in the OMEA samples and the interface structure between the matrix and FeO particles.aThe high-angle annular dark field (HAADF) image of OMEA.bThe corresponding elemental distribution mapping of Fe, Co, Ni and O elements in (a).cHigh resolution TEM image showing a semi-coherent interface across the boundary between FeO nanoparticle and FCC matrix, the insets show the fast Fourier transform (FFT) pattern of the FeO region and the enlarged image of the interface, respectively.Full size imageThe results presented above illustrate that the dual phase structure of the LPBF Fe45Co30Ni25MEA can be dynamically tailored in situ through the utilization of Fe2O3-coated elemental powders. During the LPBF process, these Fe2O3nano-oxides undergo a reduction reaction and transform into FeO nano-oxides that act as nucleation sites for the FCC phase. Notably, the attainment of an FCC single phase in the bulky FeCoNi MEA is highly important, as a single FCC phase is advantageous for processability and allows modulation of magnetic properties through heat treatment. Furthermore, this phase engineering approach and subsequent annealing treatment also reduce the residual stress and local misorientation, as evidenced by the decrease in GND density, which is important for improving magnetic properties.Magnetic propertiesFigure5a, bdisplay the magnetic properties of MEA, OMEA, and H-OMEA, respectively. All the samples exhibit typical soft ferromagnetic behavior. The measured saturation magnetic flux density and coercivity of the MEA areBs= 2.00 T andHc= 920 A m−1, respectively. The OMEA exhibitsBs= 1.90 T andHc= 600 A m−1with a significant decrease inHcalthough the saturation flux density shows a slight decrease. Most significantly, H-OMEA exhibits a significant improvement in the magnetic properties, withBs= 2.05 T andHc= 115 A m−1. In addition, the maximum relative permeability of different samples was also measured, with values of 548, 459 and 1058 for MEA, OMEA and H-OMEA, respectively (FigureS9). Although these values are not high, they are greater than the reported relative permeability (654-964) of Fe-6.5Si alloys manufactured by electron-beam-based additive manufacturing11. In fact, the relative permeability of H-OMEA (1058) is still acceptable for applications in axial flux motors29. To highlight the superiority of soft-magnetic properties for the investigated MEA and relative composite, an Ashby-plot of saturation mass magnetization versus coercivity between our three samples (i.e., MEA, OMEA and H-OMEA) and other 3D-printed soft-magnetic alloys reported thus far17,18,19,20,30,31,32,33,34,35,36,37,38,39,40is constructed, as shown in Fig.5c. Our samples exhibit an excellent combination of saturation mass magnetization and coercivity over other 3D-printed soft-magnetic alloys; in particular, the coercivity of H-OMEA is 46 times lower than that of state-of-the-art soft-magnetic Fe-Si-Cr-B-C amorphous alloys produced by LPBF (Hc= 5100 A m−1), while its saturation magnetic flux density is 50% higher17. Moreover, both OMEA and H-OMEA exhibit enhanced electrical resistivity (ρ≈ 50 μΩ cm), as shown in Fig.5d, that is 2.3 times greater than that of LPBF and as-cast MEA (ρ≈ 22 μΩ cm), and also higher than any other as-cast FeCoNi alloys (13–25 μΩ cm41), a characteristic well-suited for high-frequency applications. This increased resistivity can be attributed to the presence of FeO nano-oxides and possibly an oxygen solution in the MEA matrix.Fig. 5: The magnetic properties of the MEA, OMEA, and H-OMEA samples and the comparison with other 3D-printed soft magnetic alloys.aThe B-H curves of the MEA, OMEA and H-OMEA, respectively.bThe magnified view of the hysteresis loop in (a).cComparison of the magnetic properties in terms of saturation mass magnetization (σs) and coercivity (Hc) in the present 3D-printed MEAs with previously reported 3D-printed soft magnetic alloys.d,eThe electronic resistivity (ρ) and power loss (1 T @ 50 Hz) of MEA, OMEA and H-OMEA, respectively. ThePeandPhare eddy current loss and hysteresis loss, respectively. The inset in (e) shows the sample schematic for testing power loss. Error bars represent standard deviation.Full size imageFurthermore, the power loss of the three samples is also compared, with measurements conducted at 50 Hz and 1 T as an example. As illustrated in Fig.5e, the total power loss in the MEA incorporated with FeO nano-oxide is only half that of the sample without FeO nano-oxides. Due to its low coercivity and high resistivity, H-OMEA exhibits the lowest power loss. Importantly, the power losses include both hysteresis loss (Ph) associated with coercivity and eddy current loss (Pe) dependent on electrical resistivity. In the present cases, it is estimated that more than 75% of the power loss arises from hysteresis loss for MEA and OMEA, whereas the hysteresis loss accounts for only 46% for H-OMEA (see calculation details in FigureS10and supplementary note 1). This finding underscores the critical importance of reducing coercivity in additively manufactured soft-magnetic alloys. This study offers an effective approach through nano-oxide decoration and phase engineering to successfully reduce coercivity.The coercivity is typically governed by the mobility of magnetic domain walls. Various structural defects, such as grain boundaries and incoherent phase interfaces, can impede the movement of domain walls, leading to an increase in coercivity8. In our study, the MEA sample comprises incoherent phase interfaces between FCC and BCC phases and a substantial number of grain boundaries in the region of ultrafine BCC grains. Consequently, it is anticipated that such a phase structure will pose a more significant hindrance to the movement of domain walls compared to the OMEA and H-OMEA samples, which feature only a single FCC structure. To validate this hypothesis, we investigated the interactions between magnetic domain walls and different microstructures in MEA and H-OMEA samples using in situ Lorentz TEM under varying applied magnetic field strengths. Fig.6a–cdisplay TEM images of the MEA sample, which show the movements of domain walls (indicated by white lines) as the magnetic field strength increases. As the MEA sample has a dual-phase structure (i.e., FCC + BCC), we investigated the movement of a magnetic domain in different regions. In the FCC region (Fig. 6a1–a3), in the demagnetized state (0 mT), only a primary domain wall pinned by a grain boundary (referred to GB1) is observed. As the applied magnetic field strength increases to 40 mT, the domain wall rapidly moves across GB1 and is then pinned by two additional grain boundaries (GB2 and GB3). Upon further increasing the applied magnetic field strength to 80 mT, the domain wall successfully breaks free from the pinning effect of most grain boundaries. Conversely, in the ultrafine-grained BCC region, a multitude of domain walls with irregular morphology are present in the demagnetized state (0 mT), resulting in numerous small-scale magnetic domains with a high pinning effect. Indeed, as observed in Fig. 6b2, b3, the presence of ultrafine grains in the BCC region significantly hinders domain wall movement, leading to high coercivity. Regarding the FCC/BCC interfacial region, it is evident that these heterogeneous-phase interfaces exert a strong pinning effect on domain wall movement. Even as the applied magnetic field strength increases to 80 mT (Fig. 6c3), most domain walls remain pinned at the interfaces. In contrast to the complex phase/grain structure in the MEA sample, which has a relatively detrimental influence on the movement of the domain walls, the H-OMEA sample has a simple structure and, consequently a weaker hindrance to the movement of the domain walls, as shown in Fig.6d. The domain wall easily moves across the FeO micro-oxides as the magnetic field increases to 35 mT (Fig. 6d2, d3). The ease of movement may be attributed to the FCC/FeO semi-coherent interface6and the larger grain size of the FCC phase, which exerts a much weaker pinning effect relative to heterogeneous-phase interfaces (e.g., FCC/BCC phases) and ultrafine BCC grains.Fig. 6: In-situ Lorentz TEM images with increasing external magnetic field.a1–a3 FCC region in MEA;b1-b3 BCC region in MEA;c1-c3 FCC/BCC interface in MEA andd1–d3 FCC/FeO interface in H-OMEA. The circle shows the movement of a specific point on the domain wall under an external field. The abbreviation “DW” stands for domain wall, while “GB” stands for grain boundary.Full size imageTo provide a quantitative characterization of the magnetization process, we recorded the displacement of specific points on domain walls (as the circles shown in Fig.6) in different regions of MEA and H-OMEA samples as a function of applied magnetic field strength, as illustrated in Fig.7a, b. Clearly, the movement of domain walls is the fastest in the FCC phases in both the MEA and H-OMEA samples, followed by the FCC/BCC interfaces and then the single BCC phases in the MEA sample. This observation aligns with the random anisotropy model42, which suggests that the phase with a grain size of approximately 1 μm (i.e., the BCC region in MEA) exhibits the highest coercivity (FigureS11). In addition to the effect of the dual-phase structure, FeO particles with different sizes in the OMEA and H-OMEA samples may also have varying effects on the movement of domain walls. To clarify this issue, we further conducted in situ Lorentz TEM to investigate the interaction between FeO particles (with different sizes) and domain walls in OMEA and H-OMEA. In the OMEA, it is obvious that a domain wall is visibly pinned by a few nano-FeO particles when the magnetic field is 0 mT (FigureS12–b1). As the applied magnetic field strength increases to 6.5 mT (FigureS12–b2), a portion of the domain wall (Point 1) rapidly traverses nano-FeO particle 1 and dissipates. With increasing magnetic field, another section of the domain wall (Point 2) successfully disengages from the pinning effect of nano-FeO particle 2 and moves towards the edge of the view as the magnetic field increased to 20 mT (FigureS12–b3). In the H-OMEA, on the other hand, a domain wall is visible near the μm-FeO particles when the magnetic field is 0 mT (FigureS12–c1). The domain wall is pinned by the μm-FeO particles at 25 mT (FigureS12–c2). As the magnetic field increases to 35 mT, the domain wall easily moves across the μm-FeO (FigureS12–c3). Comparatively, the approximately nm-sized FeO particles (∼100 nm) exhibit a slightly weaker pinning effect on the movement of domain walls than the μm-sized FeO particles (∼1 μm) in H-OMEA (FigureS13), which aligns with the random anisotropy model. However, it is essential to note that the hindering effect of FeO particles, regardless of their size (nm or μm), on the movement of domain walls is much weaker than that of the grain boundaries and phase interfaces, as demonstrated in FigureS13. The magnetic field strength required to overcome the pinning from FCC grain boundaries is markedly greater than that of nano- or micro-sized FeO particles. Therefore, we can conclude that the large equiaxed grains in H-OMEA with low grain boundary density are the main reasons for the decreased coercivity compared to those in OMEA and other additively manufactured high-entropy alloys with fine columnar grains.Fig. 7: The movement and schematic drawing of the domain walls of MEA, OMEA and H-OMEA samples.aMovement of domain walls under external field in the FCC region, BCC region and the interface between FCC/BCC region of MEA.bMovement of domain walls under external field in the H-OMEA.c,dThe schematic drawing of the domain walls, phase constitution and grain boundaries in MEA and OMEA/H-OMEA, respectively.Full size imageBased on the in situ TEM observations, the impact of the microstructure in the MEA and OMEA on the magnetic moment is schematically illustrated in Fig.7c, d. In the FCC/BCC dual phase structure of the MEA, a multitude of grain boundaries in the ultrafine-grained BCC region and the BCC/FCC interfaces effectively pin domain walls, resulting in high coercivity. Conversely, in the single FCC phase of the OMEA, the grain boundaries in the FCC region and the semi-coherent FCC/FeO interfaces exert significantly weaker pinning effects on domain wall movement, thereby reducing the coercivity. Upon high-temperature annealing, which increases the grain size of the FCC phase and significantly decreases the grain boundary density, the coercivity further decreases. These considerations underscore the importance of carefully controlling phase constituents and phase interfaces to minimize their pinning effects on domain wall movement, ultimately determining the coercivity of alloys. The design of a single-phase FCC structure with coherent or semi-coherent nanoparticles appears to be an optimal choice for additive manufacturing of soft-magnetic multicomponent alloys.In conclusion, our study demonstrated an innovative approach for the fabrication of a high-performance soft-magnetic alloy of Fe45Co30Ni25MEA decorated with FeO nano-oxides by in situ alloying during LPBF followed by high-temperature annealing. The resulting LPBF MEA composite exhibited exceptional magnetic properties, featuring a high magnetic flux density (Bs= 2.05 T) and remarkably low coercivity (Hc= 115 A m−1), surpassing those of existing additively manufactured soft-magnetic alloys reported thus far. Additionally, the presence of FeO nano-oxides contributed to a twofold increase in the electrical resistivity, resulting in significantly reduced power losses relative to the MEA without FeO. Furthermore, our analysis revealed that grain boundaries within the fine-grained BCC region and the BCC/FCC interfaces exerted a noticeable pinning effect on domain wall movement in the MEA devoid of nano-oxides. Conversely, the inclusion of coarse-grained FCC phases and semi-coherent FeO nano-oxides weakened the hindrance of domain wall movement, leading to reduced coercivity. These findings offer valuable insights and pave the way for the development of advanced soft-magnetic alloys tailored for additive manufacturing.MethodsFeedstock preparationCommercial Fe, Co, and Ni spherical powders (Xi’an Sailong Metal Materials Co., Ltd.) with purities greater than 99.9% and diameters ranging from 15 to 53 μm were used in this study. The powders with a nominal composition of Fe45Co30Ni25(at. %) were mechanically mixed using a planetary ball mill device (Turbula t2f, Glen Mills) for 0.5 h at a constant rotation speed of 100 rpm. Agate balls with a diameter of 5 mm were employed, and the ball-to-powder weight ratio was set to be 1:1. In addition to these elemental powders, Fe2O3powders (Sigma-Aldrich) with a particle size less than 30 nm were utilized. To effectively coat the nano-Fe2O3particles onto the elemental powders without agglomeration, a surface engineering approach was implemented employing layer-by-layer assembly technology, as previously described21. In brief, the elemental powders were initially mixed in a solution containing 4 mg mL−1poly (diallyldimethylammonium chloride) (PDDA) and stirred for one hour. Subsequently, the powders were rinsed in deionized water and immersed in a 4 mg mL−1poly (sodium 4-styrene sulfonate) (PSS) solution with stirring for one hour. Next, the rinsed powders were blended with the red-colored Fe2O3suspension and stirred for 0.5 h until sedimentation occurred, indicating the successful coating of the elemental powders with nano-Fe2O3. After removal of the liquid, the powders were dried using a vacuum drying oven. Following the preparation of the feedstock, the powder mixtures were characterized by scanning electron microscopy (SEM, FEI Sirion 200) equipped with energy-dispersive X-ray spectroscopy (EDX).Additive manufacturingLaser powder bed fusion was conducted using a custom-built 3D printing apparatus (HUSTBMG-1, China) equipped with a 1060 nm wavelength fiber laser, boasting a maximum laser power of 500 W and a laser spot size of 80 μm. Prior to the LPBF, the chamber underwent an initial evacuation to achieve a pressure of 20 Pa. Subsequently, high-purity argon (Ar) gas was introduced to maintain the oxygen (O2) content below 100 ppm throughout the entire LPBF process. The previously determined optimized 3D-printing parameters were configured as follows: laser power (P= 220 W), scanning speed (v= 400 mm/s), layer thickness (t= 40 μm), and hatch spacing (h= 60 μm). In an effort to mitigate thermal stress, a scanning strategy was implemented wherein the laser scanning direction alternated by 90° between adjacent layers. For the subsequent heat treatment, the LPBF OMEA samples were first sealed within vacuum quartz tubes (less than 5 Pa) and then subjected to isothermal annealing. Subsequently, furnace cooling was employed to complete the annealing process. To determine the optimal heat treatment parameters, a few OMEA samples were prepared to be annealed at 600–1200 °C for 2 h, among them, the sample annealed at 1200°C was found to have the lowest coercivity (FigureS6a), so the temperature of 1200°C was fixed. Then, another set of samples were prepared and further annealed at this temperature for various times (i.e., 2-30 h). It was found that the sample annealed for 20 h exhibited the lowest coercivity (FigureS6b), so the heat treatment with 1200 °C for 20 h was determined as the optimal annealing parameters.Microstructure characterizationThe phase structure of the LPBF and heat-treated samples was investigated by X-ray diffraction (XRD, 7000SX, Shimadzu) using Cu-Kα radiation under the following conditions: step-scan mode with a step size of 0.02° (2θ) and a counting time of 0.25 s/step. The microstructure was analysed using scanning electron microscopy (SEM, FEI Sirion 200) and electron backscattered diffraction (EBSD, JEOL 7200 F). The EBSD samples were ground with SiC papers up to 1500 grit, and subsequently polished, followed by an ion beam milling process. The EBSD data were analysed using OIM Analysis 7.3 software. TEM characterization was performed on an FEI Tecnai F30 transmission electron microscope operated at an acceleration voltage of 300 kV in both TEM and scanning TEM (STEM) modes. The TEM specimens were prepared either by the ion milling or by focused ion beam (FIB) lift-out technique.Magnetic property measurementsThe saturation magnetic flux density and coercivity were measured with a superconducting quantum interferometer (SQUID, MPMS3)-vibrating sample magnetometer (VSM) module under a maximum applied field of 1200000 A m−1. The electrical resistivity was measured by a multifunction digital four-probe resistance tester (TX-300A). Iron loss was measured using a broadband AC magnetic property tester (TD8530). The permeability was investigated using a MATS-2010 SD soft-magnetic tester using toroidal samples (inner diameter of 18 mm, outer diameter of 28 mm, and thickness of 1.65 mm).In situ observation of the magnetic domainImaging of domain structures and in situ observations of domain wall movement were carried out via transmission electron microscope (TEM, FEI Tecnai F20) in Lorentz mode with varying magnetic fields.
Introduction
Soft-magnetic materials (SMMs) are receiving increasing attention because of their crucial applications in the transportation and energy sectors1,2,3. The global SMM market is expected to surpass $85 billion by 20264. Significantly, even minor enhancements in the magnetic properties of SMMs can lead to substantial energy conservation. This impetus fuels the pursuit of SMMs with the highest attainable saturation magnetic flux density (Bs> 1.8 T), minimal coercivity (Hc< 300 A m−1)5, and high electrical resistivity (ρ> 50 μΩ cm) while maintaining acceptable mechanical properties and processability. Multicomponent alloys, including medium- and high-entropy alloys (MEAs and HEAs), have surfaced as strong candidates to meet these diverse criteria6,7,8. The vast compositional spectrum of MEAs/HEAs also presents significant prospects for judicious property modulation9. For instance, the recently developed FeCoNiTaAl HEA, characterized by its ferromagnetic matrix combined with paramagnetic coherent nanoprecipitates, shows an admirable synergy of magnetic and mechanical attributes, e.g., a low coercivity of 78 A m−1, a large electrical resistivity of 103 μΩ cm, a tensile strength of 1336 MPa, and a tensile elongation of 54%6. Similarly, a B2 phase-based HEA (Al1.5Co4Fe2Cr) demonstrated a low coercivity of 127 A m−1and a high Curie temperature up to 1334 °C7. Unfortunately, theBsof these multicomponent alloys is usually low (<1 .26 T6,7), limiting their widespread applications. In addition, the processability of soft-magnetic MEAs/HEAs is always poor, which makes the fabrication of magnetic components with complex geometry be especially challenging.
In contrast to traditional manufacturing processes, additive manufacturing techniques, especially laser powder bed fusion (LPBF), have the potential to address the aforementioned challenges in processing net-shaped multicomponent alloys10,11,12. The focused high-energy beam in LPBF can melt powders into near fully dense products; simultaneously, the ultrafast cooling rate inherent to the LPBF process deters the emergence of unwanted intermetallic compounds and minimizes the diffusion of constituent elements, facilitating microstructure refinement12. More importantly, this technique enables in situ alloying and microstructure modifications during the LPBF process, allowing the magnetic properties to be tailored for specific applications13. In recent years, laser additive manufacturing has been extensively employed for processing a variety of soft-magnetic materials—including Fe-Ni alloys10, Fe-Co alloys14, Fe-Si alloys15, Fe-based amorphous/nanocrystalline alloys16,17, and also multicomponent alloys18,19,20.
Currently, the manipulation of the magnetic properties of additively manufactured soft-magnetic multicomponent alloys predominantly relies on the design of their compositions. For example, Chaudhary et al.18examined the effect of the addition of Al on the microstructure and magnetic properties of an equiatomic CoFeNi MEA by laser engineered net shaping (LENS). They proposed that the introduction of nonferromagnetic Al shifted the phase equilibrium from a single FCC phase to a lamellar FCC/BCC dual phase and eventually to a single BCC (B2) phase with increasing Al content. The optimal alloy, Al10(CoFeNi), characterized by its lamellar FCC/BCC structure, exhibited a saturation magnetization of 127 emu g−1and a Curie temperature of 475 °C, but a relatively high coercivity of 320 A m−1. Recently, Radhakrishnan et al.19reported that the coercivity could be significantly reduced when Cr was incorporated in the equiatomic CoFeNi MEA alloy (6-10 at.% Cr); unfortunately, the saturation magnetization of the alloy also decreased proportionally with increasing Cr content. Despite these intriguing advancements, realizing additively manufactured multicomponent alloys with both highBsand lowHcvalues remains a great challenge.
In this study, we chose an FCC/BCC dual phase Fe45Co30Ni25MEA with high saturation magnetic flux density but high coercivity as the base alloy. To tailor the phase structure and related magnetic properties, an approach, namely, in situ phase engineering, is adopted, in which elemental powders (Fe, Co, and Ni) with nanoscale Fe2O3coatings are chosen as feedstocks, which are then subjected to LPBF to complete in situ alloying. The LBPF MEA composite with a single FCC phase in the matrix (rather than FCC/BCC dual phase) incorporated with nano-FeO particles is achieved. After annealing, this composite shows remarkable magnetic characteristics, including a high saturation magnetic flux density (Bs= 2.05 T), low coercivity (Hc= 115 A m−1), and fairly high electrical resistivity (ρ≈ 50 μΩ cm) that is two times greater than that of the casting alloy. The correlation between the phase structure and the resultant magnetic properties is discussed based on Lorentz transmission electron microscope (TEM) analysis.
Results and Discussion
Alloy design and material preparation
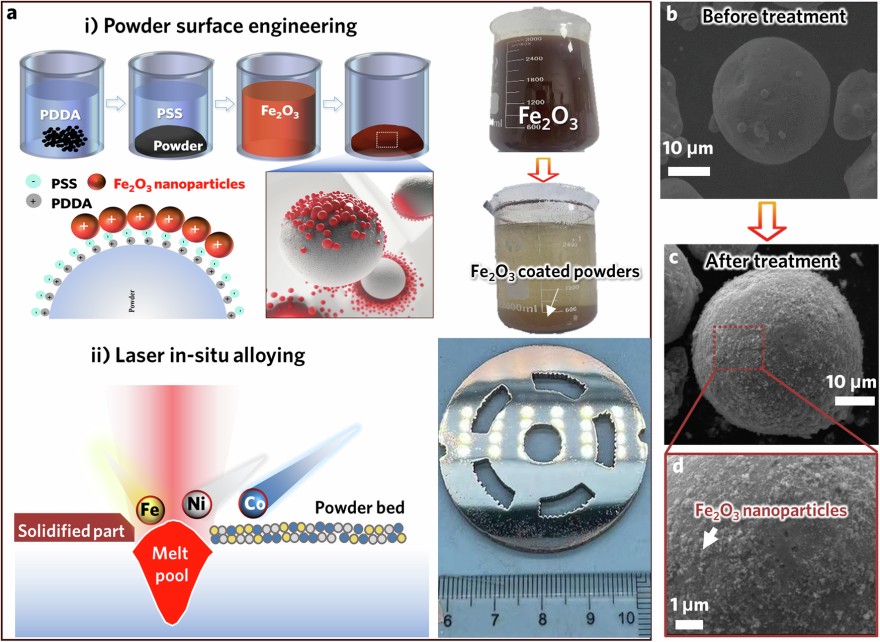
As a proof-of-concept for our alloy design methodology, we selected a high-saturation magnetic flux density (Bs) soft-magnetic alloy, Fe45Co30Ni25MEA, as the base material. To adjust its phase/structure and magnetic properties, we chose Fe2O3nano-oxide as a powder modifier. The fabrication process for the nano-oxide dispersed MEA is schematically depicted in Fig.1aand comprises two key steps: 1) coating the elemental powders with Fe2O3nano-oxide by a wet chemical approach and 2) in situ alloying of the elemental powders and Fe2O3particles to achieve the desired phases and structures during LPBF process. In the first step, pure elemental Fe, Co, and Ni powders with nominal compositions are premixed by ball milling, and the mixed powders are subsequently coated with Fe2O3nano-oxide particles through a layer-by-layer assembly technique21, as described in detail in the Experimental Section. A real-time video of the Fe2O3coating process was recorded via optical microscope (Video S1). The mixed metal powders with the Fe2O3coating display a red colour and settle at the bottom of the beaker, leaving a layer of clear liquid above (Fig.1a). The uniform distribution of Fe2O3nano-oxides on the surface of individual powders was confirmed through scanning electron microscopy (SEM) imaging (Fig.1b–d) along with energy-dispersive X-ray (EDX) mapping (FigureS1). The mass percentage of the Fe2O3nano-oxides on the powders was estimated to be 5 wt.%. In the second step, the Fe2O3-coated elemental powders are subjected to LPBF for in situ alloying and sample building. This process enables the fabrication of the Fe45Co30Ni25MEA with Fe oxide and assembles large magnetic components with complex 3D geometries, such as the stator in an electric motor (as shown in the inset of Fig.1a), demonstrating the exceptional manufacturability of this chosen MEA system. It is worth noting that the rapid cooling inherent to the LPBF process tends to yield a fine-grained structure and to introduce residual stress in the LPBF sample, which is suboptimal for magnetic properties. To solve these problems, subsequent heat treatment is then applied to the LPBF samples to modify their grain structure and alleviate residual stress. For comparison, the MEA sample without addition of Fe2O3was also prepared via LPBF. Henceforth, the LPBF samples made from elemental powders and the Fe2O3-coated elemental powders are referred to as MEA and OMEA, respectively, while the OMEA sample after heat treatment is referred to as H-OMEA.
Microstructural characterization and phase transformation
Fig.2shows the microstructures of the MEA, OMEA, and H-OMEA samples. In the case of MEA, the X-ray diffraction (XRD) pattern (Fig.2a) reveals a dual phase structure consisting of FCC and BCC phases, consistent with the Fe-Ni-Co ternary phase diagram (FigureS2)22. This result validates the success of in situ alloying by laser additive manufacturing of the mixed elemental powders. Note that the (220) peak of the FCC phase is prominent, indicating the occurrence of a < 110 > texture, while a relatively weak <110> texture in the BCC phase also appears. SEM observations (Fig.2b) along with the corresponding elemental mapping (FigureS3) confirm that the MEA sample is fully dense without voids or composition segregation. Notably, a heterogeneous structure is evident, with coarse grain zones (CGZs) and fine grain zones (FGZs) alternately distributed in the sample. Electron backscattered diffraction (EBSD) inverse pole figures and phase maps (Fig.2c, d) reveal that the CGZs located inside the molten pools (MPs) exhibit columnar grains with FCC structures, while the FGZs positioned at the boundaries of the MPs display equiaxed grains with BCC structure. These columnar grains grow preferentially along the < 110 > direction, which is consistent with the XRD pattern. The volume fraction is approximately 88% for the FCC phase and 12% for the BCC phase, respectively, with average grain sizes of 21.2 μm (in width) for the FCC phase and 4.4 μm (in diameter) for the BCC phase. The geometrically necessary dislocation (GND) density, measured by EBSD, was determined to be 1.59 × 10¹⁴m−2(FigureS4). It is worth noting that the GND density is 1.45 × 10¹⁴m−2in the FCC phase, while the GND density is 3.61 × 10¹⁴m−2in the BCC phase. The higher GNDs density in BCC phase indicates that a greater residual stress exists in this phase, which is attributed to the higher temperature gradient and higher cooling rate at the MP boundaries than at the MPs23.
In contrast, for OMEA, the microstructure significantly changes upon the introduction of Fe2O3nano-oxides. First, the XRD pattern (Fig.2e) only displays the diffraction peaks of the FCC phase, indicating that the BCC phase is completely suppressed due to the addition of the Fe2O3nano-oxide. Second, the (200) peak becomes the most prominent, in contrast to the previous MEA sample where the (220) peak is dominant. These changes suggest that the presence of nano-Fe2O3promotes the formation of the FCC phase and changes the orientation, and the related mechanism will be discussed in a later section. Third, the FCC/BCC dual phase structure in the MEA sample is replaced by a single FCC phase with a uniform columnar structure and an average width of 42.1 μm in the OMEA sample (Fig.2g, h). The length-to-width ratio of these columnar grains is notably larger than that in MEA, because the growth of columnar grains is unlimited without hindrance from BCC equiaxed grains. The GND density in the OMEA was measured to be 1.08 × 10¹⁴m−2(FigureS4), which is lower than that in the MEA. Note that both XRD and EBSD fail to detect the presence of the Fe2O3phase due to its small amount and ultrafine size. However, it is apparent that most of the Fe2O3oxide particles are distributed uniformly in the sample (FigureS5), although slight Fe2O3oxide particle accumulation at the MP boundaries is observed owing to their low mass density.
For the H-OMEA sample, which underwent annealing under optimized conditions (1200 °C for 20 h; see details in the Experimental Section and FigureS6), both the XRD pattern and EBSD images (Fig.2i–l) indicate that the primary phase retains FCC structure. However, the columnar grains completely transform into equiaxed grains with an average size of 63.8 μm due to recrystallization and grain coarsening during the annealing treatment. Annealing twins are also observed in the FCC phase (FigureS7). The GND density in H-OMEA was measured to be 3.1 × 10¹³m−2(FigureS4), which is much less than that in the MEA and OMEA samples. In addition to the FCC phase, the FeO phase, rather than Fe2O3, is detected in the XRD pattern, and is believed to be crucial for the transformation from the dual phase (FCC + BCC) in MEA to the single FCC phase in OMEA. This will be discussed in later section.
The detailed microstructure and composition of the phases in the MEA, OMEA, and H-OMEA samples were further investigated by TEM and high-angle annular dark field scanning TEM (HAADF-STEM) coupled with energy dispersive X-ray spectroscopy (EDX) mapping. Fig.3a, bdepict the detailed structures in an MP (FCC phase) and an MP boundary (BCC phase) in the MEA, respectively. In the MP (top view), cellular subgrains with sizes ranging from 1–2 μm and cellular boundary thicknesses of 100 nm are observed within each grain. The formation of cellular substructures could be attributed to the accumulation of dislocations at the cellular walls due to the high thermal stress induced by rapid heating and cooling during the LPBF process24,25. The overall composition of the FCC phase in the MP is Fe41.35Co29.80Ni28.85, with a slight enrichment of Ni. It is well known that Ni is an FCC stabilizer, which favours the formation of a pure FCC phase in MPs. On the other hand, at the MP boundary, ultrafine grains approximately 1–2 μm in diameter are formed, and their composition is determined to be Fe42.58Co37.15Ni20.27, marked by slight Co enrichment but Ni depletion compared to the nominal composition of the HEA.
Figure3c, dpresent a bright-field TEM image and the corresponding selected area electron diffraction (SAED) pattern of the OMEA, revealing an FCC single-phase structure and FeO nanoparticles (~100 nm in diameter) dispersed inside the FCC grains. The stoichiometric ratio of Fe to O in FeO is 0.77, indicating a slight depletion in Fe. Notably, these FeO nanoparticles also have an FCC structure and exhibit an orientation relationship of (020)matrix// (220)FeOwith surrounding matrix (Fig.3d). Note that, apart from the diffraction spots from the MEA matrix and FeO nanoparticles, some weak spots (as indicated by the arrows in Fig.3d) from the secondary diffraction of FeO nanoparticles are frequently detected. The FeO phase does not exist before laser scanning, and its formation is most likely due to the reaction between the Fe powders and the Fe2O3nano-oxide upon heating during laser scanning, i.e., Fe + Fe2O3→ FeO. Similar phenomena have also been reported during high-energy ball milling of Fe and Fe2O3powders26. After heat treatment, the matrix of the H-OMEA sample retains an FCC structure, while the grains of the matrix and FeO oxide particles undergo considerable coarsening, reaching ~63.8 μm for the matrix and ~1 μm for FeO, respectively. Moreover, the stoichiometric ratio of Fe to O in FeO increased to 0.83, indicating the diffusion of O during annealing (Fig.3e).
Given the crucial role of FeO nano-oxide in the BCC-to-FCC phase transformation in the OMEA, we further investigated the detailed interfacial structure between FeO particles and the FCC matrix. Fig.4a, bpresent HAADF-STEM images and EDX mapping, revealing that the nanoparticles are enriched with Fe and O. Fig.4cprovides a high-resolution TEM image of the interfacial region. The fast Fourier transform (FFT) pattern confirms again that the nanoparticle is FCC-structured FeO. Remarkably, FeO exhibits a semi-coherent interface with the FCC matrix, characterized by an orientation relationship of (020)matrix// (220)FeObut with a 14% lattice misfit. It is believed that this structural feature favours the formation of a single FCC phase in the studied Fe45Co30Ni25MEA. The detailed process is described as follows: During laser scanning, the reaction between the Fe powders and Fe2O3nano-oxides occurs upon heating, i.e., Fe + Fe2O3→ FeO. Then, both the mixed powders (Fe, Co and Ni) and the nano-FeO particles were melted. According to the Fe-O phase diagram27, the molten mixture separated into two distinct, immiscible liquids: one enriches iron and contains cobalt and nickel, and the other is predominantly composed of FeO. Upon cooling, the FeO phase could first be reprecipitated from the MP because FeO has a higher melting temperature (Tm, FeO= 1425 °C28). With further cooling, the MEA phase forms when the temperature approaches the melting point of the Fe45Co30Ni25MEA (i.e.,Tm, MEA= 1380 °C, measured with DTA (FigureS8)). In this process, the preformed FeO could serve as a nucleating agent and lead to the formation of the FCC phase but suppress BCC phase formation due to the positive effect of the preformed FeO, which also has an FCC structure and a small lattice misfit with the FCC MEA. The unique orientation relationship between FeO and FCC alters the texture of the FCC phase, transitioning it from the original < 110 > to <100 > , as observed in Fig.2.
The results presented above illustrate that the dual phase structure of the LPBF Fe45Co30Ni25MEA can be dynamically tailored in situ through the utilization of Fe2O3-coated elemental powders. During the LPBF process, these Fe2O3nano-oxides undergo a reduction reaction and transform into FeO nano-oxides that act as nucleation sites for the FCC phase. Notably, the attainment of an FCC single phase in the bulky FeCoNi MEA is highly important, as a single FCC phase is advantageous for processability and allows modulation of magnetic properties through heat treatment. Furthermore, this phase engineering approach and subsequent annealing treatment also reduce the residual stress and local misorientation, as evidenced by the decrease in GND density, which is important for improving magnetic properties.
Magnetic properties
Figure5a, bdisplay the magnetic properties of MEA, OMEA, and H-OMEA, respectively. All the samples exhibit typical soft ferromagnetic behavior. The measured saturation magnetic flux density and coercivity of the MEA areBs= 2.00 T andHc= 920 A m−1, respectively. The OMEA exhibitsBs= 1.90 T andHc= 600 A m−1with a significant decrease inHcalthough the saturation flux density shows a slight decrease. Most significantly, H-OMEA exhibits a significant improvement in the magnetic properties, withBs= 2.05 T andHc= 115 A m−1. In addition, the maximum relative permeability of different samples was also measured, with values of 548, 459 and 1058 for MEA, OMEA and H-OMEA, respectively (FigureS9). Although these values are not high, they are greater than the reported relative permeability (654-964) of Fe-6.5Si alloys manufactured by electron-beam-based additive manufacturing11. In fact, the relative permeability of H-OMEA (1058) is still acceptable for applications in axial flux motors29. To highlight the superiority of soft-magnetic properties for the investigated MEA and relative composite, an Ashby-plot of saturation mass magnetization versus coercivity between our three samples (i.e., MEA, OMEA and H-OMEA) and other 3D-printed soft-magnetic alloys reported thus far17,18,19,20,30,31,32,33,34,35,36,37,38,39,40is constructed, as shown in Fig.5c. Our samples exhibit an excellent combination of saturation mass magnetization and coercivity over other 3D-printed soft-magnetic alloys; in particular, the coercivity of H-OMEA is 46 times lower than that of state-of-the-art soft-magnetic Fe-Si-Cr-B-C amorphous alloys produced by LPBF (Hc= 5100 A m−1), while its saturation magnetic flux density is 50% higher17. Moreover, both OMEA and H-OMEA exhibit enhanced electrical resistivity (ρ≈ 50 μΩ cm), as shown in Fig.5d, that is 2.3 times greater than that of LPBF and as-cast MEA (ρ≈ 22 μΩ cm), and also higher than any other as-cast FeCoNi alloys (13–25 μΩ cm41), a characteristic well-suited for high-frequency applications. This increased resistivity can be attributed to the presence of FeO nano-oxides and possibly an oxygen solution in the MEA matrix.
Furthermore, the power loss of the three samples is also compared, with measurements conducted at 50 Hz and 1 T as an example. As illustrated in Fig.5e, the total power loss in the MEA incorporated with FeO nano-oxide is only half that of the sample without FeO nano-oxides. Due to its low coercivity and high resistivity, H-OMEA exhibits the lowest power loss. Importantly, the power losses include both hysteresis loss (Ph) associated with coercivity and eddy current loss (Pe) dependent on electrical resistivity. In the present cases, it is estimated that more than 75% of the power loss arises from hysteresis loss for MEA and OMEA, whereas the hysteresis loss accounts for only 46% for H-OMEA (see calculation details in FigureS10and supplementary note 1). This finding underscores the critical importance of reducing coercivity in additively manufactured soft-magnetic alloys. This study offers an effective approach through nano-oxide decoration and phase engineering to successfully reduce coercivity.
The coercivity is typically governed by the mobility of magnetic domain walls. Various structural defects, such as grain boundaries and incoherent phase interfaces, can impede the movement of domain walls, leading to an increase in coercivity8. In our study, the MEA sample comprises incoherent phase interfaces between FCC and BCC phases and a substantial number of grain boundaries in the region of ultrafine BCC grains. Consequently, it is anticipated that such a phase structure will pose a more significant hindrance to the movement of domain walls compared to the OMEA and H-OMEA samples, which feature only a single FCC structure. To validate this hypothesis, we investigated the interactions between magnetic domain walls and different microstructures in MEA and H-OMEA samples using in situ Lorentz TEM under varying applied magnetic field strengths. Fig.6a–cdisplay TEM images of the MEA sample, which show the movements of domain walls (indicated by white lines) as the magnetic field strength increases. As the MEA sample has a dual-phase structure (i.e., FCC + BCC), we investigated the movement of a magnetic domain in different regions. In the FCC region (Fig. 6a1–a3), in the demagnetized state (0 mT), only a primary domain wall pinned by a grain boundary (referred to GB1) is observed. As the applied magnetic field strength increases to 40 mT, the domain wall rapidly moves across GB1 and is then pinned by two additional grain boundaries (GB2 and GB3). Upon further increasing the applied magnetic field strength to 80 mT, the domain wall successfully breaks free from the pinning effect of most grain boundaries. Conversely, in the ultrafine-grained BCC region, a multitude of domain walls with irregular morphology are present in the demagnetized state (0 mT), resulting in numerous small-scale magnetic domains with a high pinning effect. Indeed, as observed in Fig. 6b2, b3, the presence of ultrafine grains in the BCC region significantly hinders domain wall movement, leading to high coercivity. Regarding the FCC/BCC interfacial region, it is evident that these heterogeneous-phase interfaces exert a strong pinning effect on domain wall movement. Even as the applied magnetic field strength increases to 80 mT (Fig. 6c3), most domain walls remain pinned at the interfaces. In contrast to the complex phase/grain structure in the MEA sample, which has a relatively detrimental influence on the movement of the domain walls, the H-OMEA sample has a simple structure and, consequently a weaker hindrance to the movement of the domain walls, as shown in Fig.6d. The domain wall easily moves across the FeO micro-oxides as the magnetic field increases to 35 mT (Fig. 6d2, d3). The ease of movement may be attributed to the FCC/FeO semi-coherent interface6and the larger grain size of the FCC phase, which exerts a much weaker pinning effect relative to heterogeneous-phase interfaces (e.g., FCC/BCC phases) and ultrafine BCC grains.
To provide a quantitative characterization of the magnetization process, we recorded the displacement of specific points on domain walls (as the circles shown in Fig.6) in different regions of MEA and H-OMEA samples as a function of applied magnetic field strength, as illustrated in Fig.7a, b. Clearly, the movement of domain walls is the fastest in the FCC phases in both the MEA and H-OMEA samples, followed by the FCC/BCC interfaces and then the single BCC phases in the MEA sample. This observation aligns with the random anisotropy model42, which suggests that the phase with a grain size of approximately 1 μm (i.e., the BCC region in MEA) exhibits the highest coercivity (FigureS11). In addition to the effect of the dual-phase structure, FeO particles with different sizes in the OMEA and H-OMEA samples may also have varying effects on the movement of domain walls. To clarify this issue, we further conducted in situ Lorentz TEM to investigate the interaction between FeO particles (with different sizes) and domain walls in OMEA and H-OMEA. In the OMEA, it is obvious that a domain wall is visibly pinned by a few nano-FeO particles when the magnetic field is 0 mT (FigureS12–b1). As the applied magnetic field strength increases to 6.5 mT (FigureS12–b2), a portion of the domain wall (Point 1) rapidly traverses nano-FeO particle 1 and dissipates. With increasing magnetic field, another section of the domain wall (Point 2) successfully disengages from the pinning effect of nano-FeO particle 2 and moves towards the edge of the view as the magnetic field increased to 20 mT (FigureS12–b3). In the H-OMEA, on the other hand, a domain wall is visible near the μm-FeO particles when the magnetic field is 0 mT (FigureS12–c1). The domain wall is pinned by the μm-FeO particles at 25 mT (FigureS12–c2). As the magnetic field increases to 35 mT, the domain wall easily moves across the μm-FeO (FigureS12–c3). Comparatively, the approximately nm-sized FeO particles (∼100 nm) exhibit a slightly weaker pinning effect on the movement of domain walls than the μm-sized FeO particles (∼1 μm) in H-OMEA (FigureS13), which aligns with the random anisotropy model. However, it is essential to note that the hindering effect of FeO particles, regardless of their size (nm or μm), on the movement of domain walls is much weaker than that of the grain boundaries and phase interfaces, as demonstrated in FigureS13. The magnetic field strength required to overcome the pinning from FCC grain boundaries is markedly greater than that of nano- or micro-sized FeO particles. Therefore, we can conclude that the large equiaxed grains in H-OMEA with low grain boundary density are the main reasons for the decreased coercivity compared to those in OMEA and other additively manufactured high-entropy alloys with fine columnar grains.
Based on the in situ TEM observations, the impact of the microstructure in the MEA and OMEA on the magnetic moment is schematically illustrated in Fig.7c, d. In the FCC/BCC dual phase structure of the MEA, a multitude of grain boundaries in the ultrafine-grained BCC region and the BCC/FCC interfaces effectively pin domain walls, resulting in high coercivity. Conversely, in the single FCC phase of the OMEA, the grain boundaries in the FCC region and the semi-coherent FCC/FeO interfaces exert significantly weaker pinning effects on domain wall movement, thereby reducing the coercivity. Upon high-temperature annealing, which increases the grain size of the FCC phase and significantly decreases the grain boundary density, the coercivity further decreases. These considerations underscore the importance of carefully controlling phase constituents and phase interfaces to minimize their pinning effects on domain wall movement, ultimately determining the coercivity of alloys. The design of a single-phase FCC structure with coherent or semi-coherent nanoparticles appears to be an optimal choice for additive manufacturing of soft-magnetic multicomponent alloys.
In conclusion, our study demonstrated an innovative approach for the fabrication of a high-performance soft-magnetic alloy of Fe45Co30Ni25MEA decorated with FeO nano-oxides by in situ alloying during LPBF followed by high-temperature annealing. The resulting LPBF MEA composite exhibited exceptional magnetic properties, featuring a high magnetic flux density (Bs= 2.05 T) and remarkably low coercivity (Hc= 115 A m−1), surpassing those of existing additively manufactured soft-magnetic alloys reported thus far. Additionally, the presence of FeO nano-oxides contributed to a twofold increase in the electrical resistivity, resulting in significantly reduced power losses relative to the MEA without FeO. Furthermore, our analysis revealed that grain boundaries within the fine-grained BCC region and the BCC/FCC interfaces exerted a noticeable pinning effect on domain wall movement in the MEA devoid of nano-oxides. Conversely, the inclusion of coarse-grained FCC phases and semi-coherent FeO nano-oxides weakened the hindrance of domain wall movement, leading to reduced coercivity. These findings offer valuable insights and pave the way for the development of advanced soft-magnetic alloys tailored for additive manufacturing.
Methods
Feedstock preparation
Commercial Fe, Co, and Ni spherical powders (Xi’an Sailong Metal Materials Co., Ltd.) with purities greater than 99.9% and diameters ranging from 15 to 53 μm were used in this study. The powders with a nominal composition of Fe45Co30Ni25(at. %) were mechanically mixed using a planetary ball mill device (Turbula t2f, Glen Mills) for 0.5 h at a constant rotation speed of 100 rpm. Agate balls with a diameter of 5 mm were employed, and the ball-to-powder weight ratio was set to be 1:1. In addition to these elemental powders, Fe2O3powders (Sigma-Aldrich) with a particle size less than 30 nm were utilized. To effectively coat the nano-Fe2O3particles onto the elemental powders without agglomeration, a surface engineering approach was implemented employing layer-by-layer assembly technology, as previously described21. In brief, the elemental powders were initially mixed in a solution containing 4 mg mL−1poly (diallyldimethylammonium chloride) (PDDA) and stirred for one hour. Subsequently, the powders were rinsed in deionized water and immersed in a 4 mg mL−1poly (sodium 4-styrene sulfonate) (PSS) solution with stirring for one hour. Next, the rinsed powders were blended with the red-colored Fe2O3suspension and stirred for 0.5 h until sedimentation occurred, indicating the successful coating of the elemental powders with nano-Fe2O3. After removal of the liquid, the powders were dried using a vacuum drying oven. Following the preparation of the feedstock, the powder mixtures were characterized by scanning electron microscopy (SEM, FEI Sirion 200) equipped with energy-dispersive X-ray spectroscopy (EDX).
Additive manufacturing
Laser powder bed fusion was conducted using a custom-built 3D printing apparatus (HUSTBMG-1, China) equipped with a 1060 nm wavelength fiber laser, boasting a maximum laser power of 500 W and a laser spot size of 80 μm. Prior to the LPBF, the chamber underwent an initial evacuation to achieve a pressure of 20 Pa. Subsequently, high-purity argon (Ar) gas was introduced to maintain the oxygen (O2) content below 100 ppm throughout the entire LPBF process. The previously determined optimized 3D-printing parameters were configured as follows: laser power (P= 220 W), scanning speed (v= 400 mm/s), layer thickness (t= 40 μm), and hatch spacing (h= 60 μm). In an effort to mitigate thermal stress, a scanning strategy was implemented wherein the laser scanning direction alternated by 90° between adjacent layers. For the subsequent heat treatment, the LPBF OMEA samples were first sealed within vacuum quartz tubes (less than 5 Pa) and then subjected to isothermal annealing. Subsequently, furnace cooling was employed to complete the annealing process. To determine the optimal heat treatment parameters, a few OMEA samples were prepared to be annealed at 600–1200 °C for 2 h, among them, the sample annealed at 1200°C was found to have the lowest coercivity (FigureS6a), so the temperature of 1200°C was fixed. Then, another set of samples were prepared and further annealed at this temperature for various times (i.e., 2-30 h). It was found that the sample annealed for 20 h exhibited the lowest coercivity (FigureS6b), so the heat treatment with 1200 °C for 20 h was determined as the optimal annealing parameters.
Microstructure characterization
The phase structure of the LPBF and heat-treated samples was investigated by X-ray diffraction (XRD, 7000SX, Shimadzu) using Cu-Kα radiation under the following conditions: step-scan mode with a step size of 0.02° (2θ) and a counting time of 0.25 s/step. The microstructure was analysed using scanning electron microscopy (SEM, FEI Sirion 200) and electron backscattered diffraction (EBSD, JEOL 7200 F). The EBSD samples were ground with SiC papers up to 1500 grit, and subsequently polished, followed by an ion beam milling process. The EBSD data were analysed using OIM Analysis 7.3 software. TEM characterization was performed on an FEI Tecnai F30 transmission electron microscope operated at an acceleration voltage of 300 kV in both TEM and scanning TEM (STEM) modes. The TEM specimens were prepared either by the ion milling or by focused ion beam (FIB) lift-out technique.
Magnetic property measurements
The saturation magnetic flux density and coercivity were measured with a superconducting quantum interferometer (SQUID, MPMS3)-vibrating sample magnetometer (VSM) module under a maximum applied field of 1200000 A m−1. The electrical resistivity was measured by a multifunction digital four-probe resistance tester (TX-300A). Iron loss was measured using a broadband AC magnetic property tester (TD8530). The permeability was investigated using a MATS-2010 SD soft-magnetic tester using toroidal samples (inner diameter of 18 mm, outer diameter of 28 mm, and thickness of 1.65 mm).
In situ observation of the magnetic domain
Imaging of domain structures and in situ observations of domain wall movement were carried out via transmission electron microscope (TEM, FEI Tecnai F20) in Lorentz mode with varying magnetic fields.
